
wolfenotes.com
Washington State ranchers are threatening to go the Legislature in 2014 to defend their “right” to pollute state waterways.
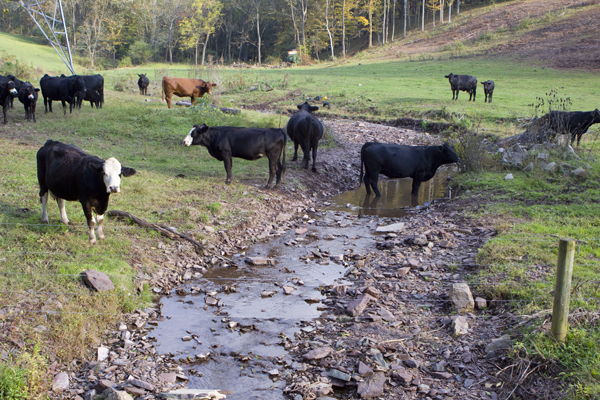
It has long been understood that cows pollute. A lot. A mature cow produces between 120 to 150 pounds of manure, etc. each day. And where the cow has access to a stream, it will cause all kinds of problems, including pathogenic pollution that is harmful to humans and aquatic life. Cattle trample stream beds and banks, causing erosion and destroying riparian vegetation.
The U.S. Environmental Protection Agency lists livestock manure as one of the last major uncontrolled sources of contaminants in the United States. (See charts at the end of this article).
On August 15, 2013, the Washington Supreme Court ruled that the state water pollution agency does have authority to order cows out of streams to protect water quality and aquatic habitat. In Lemire v. Department of Ecology, the Court held that the state water pollution act is stronger than the federal Clean Water Act, and authorizes enforcement against ranching operations that pollute public waterways.
According to an article in the Oct. 12, 2013 Spokesman-Review, representatives of the agricultural community are now asserting that they intend to try to change the law, rather than clean up state streams.
Washington has a number of laws and programs to assist ranchers to get their cattle out of state waterways. State policy allows ranchers to divert water to stock tanks, without a water right, to make sure their cattle have water. For better or worse, ranchers are allowed to pump unlimited use of groundwater with a permit. Any argument that ranchers must have access to streams in order to provide water their cattle is simply not true.
The Washington State Conservation Commission offers several programs to help farmers protect streams. The Voluntary Stewardship Program provides financial incentives for ranchers and farmers to protect streamside areas in lieu of Growth Management Act critical areas ordinances – a controversial step back from growth planning that was adopted to satisfy the agricultural community.

CREP buffers in Whatcom County (Photo: Washington Conservation Commission)
The Conservation Reserve Enhancement Program (CREP) is a joint state-federal funding program that pays ranchers to restore riparian habitat and create no-cow zones along streams. The program results are phenomenal, including more than 1,000 projects in Washington, 735 miles of streams protected, 5.2 million native trees and shrubs planted, and 1.5 million feet of fencing. At no cost to the landowner.
21st century environmental management has moved on from the 19th century mentality that a landowner can do anything he or she wants with her property. There’s an ancient Latin expression – “sic utere tuo ut alienum non laedus” – which roughly translates to mean that a person’s right to use their property does not include the right to injure the property of others. (It’s also been described as “your right to swing your fist ends at my nose.”)
Perhaps most important, Washington’s waters are owned by the public. No one has the right to pollute the commons. This is a principle that should not – and indeed cannot – be legislated away.
————————————————–
From EPA’s Animal Feeding Operation Website:
Table 1 Reference: National Water Quality Inventory: 1998 Report to Congress (EPA, 2000a). AFOs are a subset of the agriculture category. Summaries of impairment by other sources are not presented here.
| Total Quantity in US | Amount of Waters Surveyed | Quantity Impaired by All Sources | Quantity Impaired by Agriculture |
|---|---|---|---|
| Rivers 3,662,255 miles | 23% of total 840,402 miles | 36% of surveyed 248,028 miles | 59% of impaired 170,750 miles |
| Lakes, Ponds, and Reservoirs 41,600,000 acres | 42% of total 17,400,000 acres | 39% of surveyed 6,541,060 acres | 31% of impaired 2,417,801 acres |
| Estuaries 90,500 square miles | 32% of total 28,889 sq. miles | 38% of surveyed 11,025 sq.miles | 15% of impaired 1,827 sq. miles |
|
Table 2. Five Leading Pollutants Causing Water Quality Impairment in the U.S. (Percent of incidence of each pollutant is shown in parentheses, e.g., siltation is listed as a cause of impairment in 38% of impaired river miles.)
|
|||
| Rank | Rivers | Lakes | Estuaries |
|---|---|---|---|
| 1 | Siltation (38%) | Nutrients (44%) | Pathogens (47%) |
| 2 | Pathogens (36%) | Metals (27%) | Oxygen-Depleting Substances (42%) |
| 3 | Nutrients (29%) | Siltation (15%) | Metals (23%) |
| 4 | Oxygen-Depleting Substances (23%) | Oxygen-Depleting Substances (14%) | Nutrients (23%) |
| 5 | Metals (21%) | Suspended Solids (10%) | Thermal Modifications (18%) |
